Table of Contents
1 GSMF
1.1 example
1.2 all
1.3 Blue & Red
1.4 Disk & Bulge
1.5 Quiescent
2 SFRF
3 GLF
3.1 UV
4 BHMF
4.1 local
4.2 Shen et al. 2012
4.3 DRAGONS
5 QLF
5.1 UV
5.2 optical B
5.3 Bolometric
6 Magorrian Relation
7 Tully_Fisher Relation
8 DiskSize_StellarMass
9 GasFraction_StellarMass
10 sSFR_StellarMass
10.1 Blue
11 HaloMass_StellarMass
11.1 all & Blue & Red
12 QC_2PTCF
[1]:
import matplotlib
%matplotlib inline
import matplotlib.pyplot as plt
from matplotlib.colors import LogNorm
from astrodatapy.number_density import number_density
from astrodatapy.correlation    import correlation
from astrodatapy.clustering     import clustering

cosmo = {'omega_M_0' : 0.308,
'omega_lambda_0' : 0.692,
'omega_b_0' : 0.04839912,
'omega_n_0' : 0.0,
'N_nu' : 0,
'h' : 0.678,
'n' : 0.968,
'sigma_8' : 0.815
}

plt.rc('font', size=15)          # controls default text sizes
plt.rc('axes', titlesize=15)     # fontsize of the axes title
plt.rc('axes', labelsize=15)     # fontsize of the x and y labels
plt.rc('xtick', labelsize=12)    # fontsize of the tick labels
plt.rc('ytick', labelsize=12)    # fontsize of the tick labels
plt.rc('legend', fontsize=12)    # legend fontsize

colors         = ['#e41a1c','#377eb8','#4daf4a','#984ea3',\
                  '#ff7f00','#a65628','#f781bf','#999999']*4
color_maps     = ['Reds', 'Blues', 'Greens'] *4
markers        = ['o','s','v','^','<','>','p','*','D','.','8']*4
linestyles     = ['-','--','-.',':']*4
GSMF
Galaxy Stellar Mass Function
example
[2]:
obs = number_density(feature='GSMF', z_target=5.0, h=cosmo['h'])
print("Available Observations:")
obs.info
You are requesting GSMF at z_target=5.00 with a tolerance of z_tol=0.25 and h=0.678
quiet=True to silent
available data of GSMF includes:
Bell2003 Cole2001 Drory2009 Marchesini2009 Mortlock2011 Stefanon2017 Thanjavur2016 Grazian2015 Gonzalez2011 Duncan2014 Katsianis2015 Song2016 Davidzon2017 Santini2012 Ilbert2013 Muzzin2013 Huertas-Company2016 Tomczak2014 Pozzetti2007 Baldry2012 Caputi2011 Kajisawa2009 Perez-Gonzalez2008 Pozzetti2010 Yang2009 Qin2017_Tiamat Qin2017_Tiamat125_HR

Loading observational data from Stefanon2017...
Filename /home/yqin/3rd_party/lib/python3.6/site-packages/astrodatapy-0.0.dev23-py3.6.egg/astrodatapy/data//GSMF/z5pt0.dat
Converting IMF from Chabrier to Salpeter
WARNING! No Infomation about MAG, dafault is Salpeter
Converting the Errors from ULDeltas to Upper Lower Limits
Converting the Normalization of Phi from 1.00e-05 to 1
Converting x axis from h=0.700 to h=0.678 with a power of -2 because it is GSMF
Converting y axis from h=0.700 to h=0.678 with a power of 3
..done

Loading observational data from Grazian2015...
Filename /home/yqin/3rd_party/lib/python3.6/site-packages/astrodatapy-0.0.dev23-py3.6.egg/astrodatapy/data//GSMF/z5pt0.dat
WARNING! No Infomation about MAG, dafault is Salpeter
Converting x axis from h=0.700 to h=0.678 with a power of -2 because it is GSMF
Converting y axis from h=0.700 to h=0.678 with a power of 3
..done

Loading observational data from Gonzalez2011...
Filename /home/yqin/3rd_party/lib/python3.6/site-packages/astrodatapy-0.0.dev23-py3.6.egg/astrodatapy/data//GSMF/z5pt0.dat
WARNING! No Infomation about MAG, dafault is Salpeter
Converting the Errors from LUDeltas to Upper Lower Limits
Converting Phi from logarithm to linear
Converting x axis from h=1.000 to h=0.678 with a power of -2 because it is GSMF
Converting y axis from h=1.000 to h=0.678 with a power of 3
..done

Loading observational data from Duncan2014...
Filename /home/yqin/3rd_party/lib/python3.6/site-packages/astrodatapy-0.0.dev23-py3.6.egg/astrodatapy/data//GSMF/z5pt0.dat
Converting IMF from Chabrier to Salpeter
WARNING! No Infomation about MAG, dafault is Salpeter
Converting the Errors from LUDeltas to Upper Lower Limits
Converting x axis from h=0.700 to h=0.678 with a power of -2 because it is GSMF
Converting y axis from h=0.700 to h=0.678 with a power of 3
..done

Loading observational data from Katsianis2015...
Filename /home/yqin/3rd_party/lib/python3.6/site-packages/astrodatapy-0.0.dev23-py3.6.egg/astrodatapy/data//GSMF/z5pt0.dat
WARNING! No Infomation about MAG, dafault is Salpeter
Converting the Errors from Delta to Upper Lower Limits
Converting Phi from logarithm to linear
Converting x axis from h=0.702 to h=0.678 with a power of -2 because it is GSMF
Converting y axis from h=0.702 to h=0.678 with a power of 3
..done

Loading observational data from Song2016...
Filename /home/yqin/3rd_party/lib/python3.6/site-packages/astrodatapy-0.0.dev23-py3.6.egg/astrodatapy/data//GSMF/z5pt0.dat
WARNING! No Infomation about MAG, dafault is Salpeter
Converting the Errors from ULDeltas to Upper Lower Limits
Converting Phi from logarithm to linear
Converting x axis from h=0.700 to h=0.678 with a power of -2 because it is GSMF
Converting y axis from h=0.700 to h=0.678 with a power of 3
..done

Loading observational data from Davidzon2017...
Filename /home/yqin/3rd_party/lib/python3.6/site-packages/astrodatapy-0.0.dev23-py3.6.egg/astrodatapy/data//GSMF/z5pt0.dat
Using Schechter Function for Mass
Converting IMF from Chabrier to Salpeter
WARNING! No Infomation about MAG, dafault is Salpeter
Converting x axis from h=0.700 to h=0.678 with a power of -2 because it is GSMF
Converting y axis from h=0.700 to h=0.678 with a power of 3
..done

Loading observational data from Qin2017_Tiamat...
Filename /home/yqin/3rd_party/lib/python3.6/site-packages/astrodatapy-0.0.dev23-py3.6.egg/astrodatapy/data//GSMF/z5pt00.dat
WARNING! No Infomation about MAG, dafault is Salpeter
Converting the Errors from Delta to Upper Lower Limits
Converting x axis from h=0.678 to h=0.678 with a power of -2 because it is GSMF
Converting y axis from h=0.678 to h=0.678 with a power of 3
..done

Loading observational data from Qin2017_Tiamat125_HR...
Filename /home/yqin/3rd_party/lib/python3.6/site-packages/astrodatapy-0.0.dev23-py3.6.egg/astrodatapy/data//GSMF/z5pt00.dat
WARNING! No Infomation about MAG, dafault is Salpeter
Converting the Errors from Delta to Upper Lower Limits
Converting x axis from h=0.678 to h=0.678 with a power of -2 because it is GSMF
Converting y axis from h=0.678 to h=0.678 with a power of 3
..done
Available Observations:
[2]:
| IMF | h | NormalizationOfPhi | Errors | Log | HinPhi | Type | Bibliographic | |
|---|---|---|---|---|---|---|---|---|
| #Name | ||||||||
| Bell2003 | DietSalpeter | 1.000 | 1.00000 | LULimits | 0 | 0 | data | 2012MNRAS.421..621B |
| Cole2001 | Salpeter | 1.000 | 1.00000 | Delta | 0 | 0 | data | 2001MNRAS.326..255C |
| Drory2009 | Chabrier | 0.700 | 1.00000 | Delta | 1 | 0 | data | 2009ApJ...707.1595D |
| Marchesini2009 | Kroupa | 0.700 | 1.00000 | ULDeltas | 1 | 0 | data | 2009ApJ...701.1765M |
| Mortlock2011 | Salpeter | 0.700 | 1.00000 | Delta | 1 | 0 | data | 2011MNRAS.413.2845M |
| Stefanon2017 | Chabrier | 0.700 | 0.00001 | ULDeltas | 0 | 0 | data | 2017ApJ...843...36S |
| Thanjavur2016 | Chabrier | 0.700 | 1.00000 | ULDeltas | 1 | 0 | data | 2016MNRAS.459...44T |
| Grazian2015 | Salpeter | 0.700 | 1.00000 | ULLimits | 0 | 0 | data | 2015A&A...575A..96G |
| Gonzalez2011 | Salpeter | 1.000 | 1.00000 | LUDeltas | 1 | 0 | data | 2011ApJ...735L..34G |
| Duncan2014 | Chabrier | 0.700 | 1.00000 | LUDeltas | 0 | 0 | data | 2014MNRAS.444.2960D |
| Katsianis2015 | Salpeter | 0.702 | 1.00000 | Delta | 1 | 0 | data_sim | 2015MNRAS.448.3001K |
| Song2016 | Salpeter | 0.700 | 1.00000 | ULDeltas | 1 | 0 | data | 2016ApJ...825....5S |
| Davidzon2017 | Chabrier | 0.700 | 1.00000 | None | 0 | 0 | Schechter | 2017A&A...605A..70D |
| Santini2012 | Salpeter | 0.700 | 1.00000 | None | 0 | 0 | Schechter | 2012A&A...538A..33S |
| Ilbert2013 | Chabrier | 0.700 | 1.00000 | None | 0 | 0 | Schechter | 2013A&A...556A..55I |
| Muzzin2013 | Kroupa | 0.700 | 1.00000 | None | 0 | 0 | Schechter | 2013ApJ...777...18M |
| Huertas-Company2016 | Chabrier | 0.700 | 1.00000 | None | 0 | 0 | Schechter | 2016MNRAS.462.4495H |
| Tomczak2014 | Chabrier | 0.700 | 1.00000 | ULDeltas | 1 | 0 | data | 2014ApJ...783...85T |
| Pozzetti2007 | Chabrier | 0.700 | 1.00000 | None | 0 | 0 | Schechter | 2007A&A...474..443P |
| Baldry2012 | Chabrier | 0.678 | 1.00000 | ULDeltas | 1 | 0 | data | 2012MNRAS.421..621B |
| Caputi2011 | Chabrier | 0.678 | 1.00000 | ULDeltas | 1 | 0 | data | 2011MNRAS.413..162C |
| Kajisawa2009 | Chabrier | 0.678 | 1.00000 | ULDeltas | 1 | 0 | data | 2009ApJ...702.1393K |
| Perez-Gonzalez2008 | Chabrier | 0.678 | 1.00000 | ULDeltas | 1 | 0 | data | 2008ApJ...675..234P |
| Pozzetti2010 | Chabrier | 0.678 | 1.00000 | ULDeltas | 1 | 0 | data | 2010A&A...523A..13P |
| Yang2009 | Chabrier | 0.678 | 1.00000 | ULDeltas | 1 | 0 | data | 2009ApJ...695..900Y |
| Qin2017_Tiamat | Salpeter | 0.678 | 1.00000 | Delta | 0 | 0 | data_sim | 2017MNRAS.472.2009Q |
| Qin2017_Tiamat125_HR | Salpeter | 0.678 | 1.00000 | Delta | 0 | 0 | data_sim | 2017MNRAS.472.2009Q |
[3]:
print("Target Observations:")
obs.target_observation
Target Observations:
[3]:
| DataType | FileName | Data | |
|---|---|---|---|
| Name | |||
| Stefanon2017 | data | z5pt0.dat | [[10.963009197397692, 8.632141819241988e-06, 2... |
| Grazian2015 | data | z5pt0.dat | [[9.097736692294387, 0.005088420440816329, 0.0... |
| Gonzalez2011 | data | z5pt0.dat | [[7.870060612265873, 0.001921715449346003, 0.0... |
| Duncan2014 | data | z5pt0.dat | [[9.002009197397692, 0.009041032747521872, 0.0... |
| Katsianis2015 | data_sim | z5pt0.dat | [[7.825874836525483, 0.015909910816851603, 0.0... |
| Song2016 | data | z5pt0.dat | [[7.277736692294387, 0.03078895589910497, 0.05... |
| Davidzon2017 | Schechter | z5pt0.dat | [[9.283009197397693, 0.0022312861848298765, 0.... |
| Qin2017_Tiamat | data_sim | z5pt00.dat | [[7.05, 0.44436000000000025, 0.446467980000000... |
| Qin2017_Tiamat125_HR | data_sim | z5pt00.dat | [[7.05, 0.042807000000000026, 0.04306835900000... |
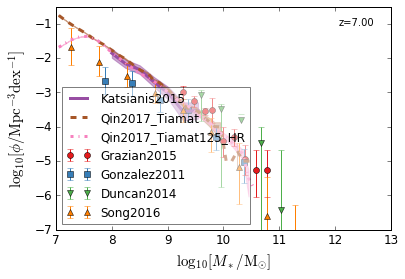
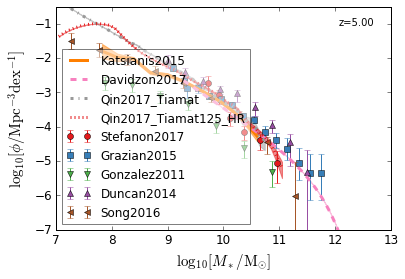
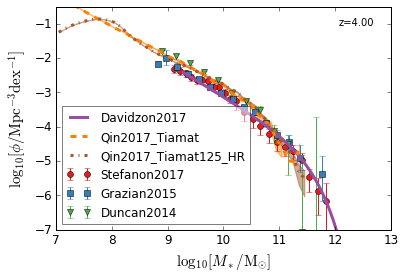
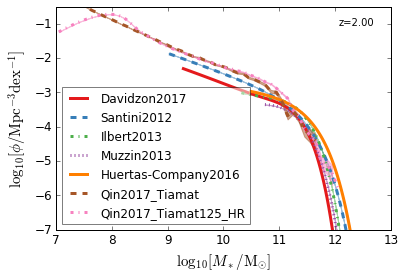
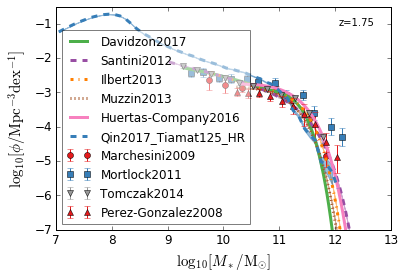
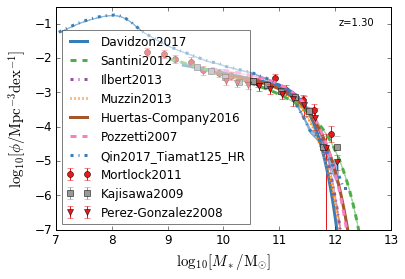
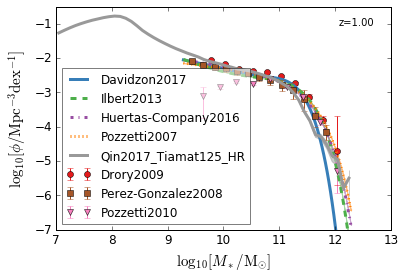
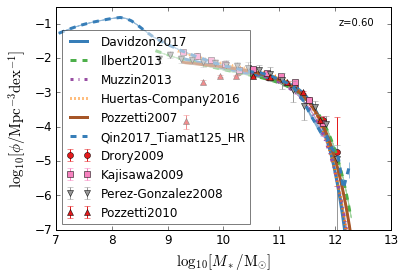
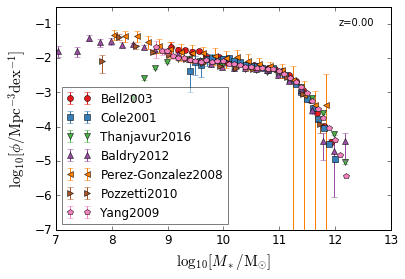
all
[4]:
feature = 'GSMF'
xlim    = (7, 13)
ylim    = (-7, -0.5)
xlabel  = r"$\log_{10}[M_*/{\rm M_{\odot}}]$"
ylabel  = r"$\log_{10}[\rm \phi/Mpc^{-3} dex^{-1}]$"
zs      = [7, 5, 4, 2, 1.75, 1.3, 1.0, 0.6, 0.0]

for z in zs:
    fig,ax = plt.subplots(1,1)
    obs    = number_density(feature=feature,z_target=z,quiet=1,h=cosmo['h'])
    j_data = 0
    k_func = 0
    for ii in range(obs.n_target_observation):
        data       = obs.target_observation['Data'][ii]
        label      = obs.target_observation.index[ii]
        datatype   = obs.target_observation['DataType'][ii]
        color      = colors[ii]
        marker     = markers[j_data]
        linestyle  = linestyles[k_func]
        data[:,1:] = np.log10(data[:,1:])
        if datatype == 'data':
            ax.errorbar(data[:,0],  data[:,1], yerr = [data[:,1]-data[:,3],data[:,2]- data[:,1]],\
                        label=label,color=color,fmt=marker)
            j_data +=1
        elif datatype == 'dataULimit':
            ax.errorbar(data[:,0],  data[:,1], yerr = -0.2*data[:,1], uplims=True,\
                        label=label,color=color,fmt=marker)
            j_data +=1
        else:
            ax.plot(data[:,0],data[:,1],label=label,color=color,linestyle=linestyle,lw=3)
            ax.fill_between(data[:,0], data[:,2],data[:,3],color=color,alpha=0.5)
            k_func +=1

    ax.set_xlim(xlim)
    ax.set_ylim(ylim)
    ax.text(0.95,0.95, "z=%.2f"%z,horizontalalignment='right',\
          verticalalignment='top',transform=ax.transAxes)
    leg = ax.legend(loc='lower left')
    leg.get_frame().set_alpha(0.5)
    ax.set_xlabel(xlabel)
    ax.set_ylabel(ylabel)
/home/yqin/3rd_party/lib/python3.6/site-packages/ipykernel_launcher.py:20: RuntimeWarning: divide by zero encountered in log10
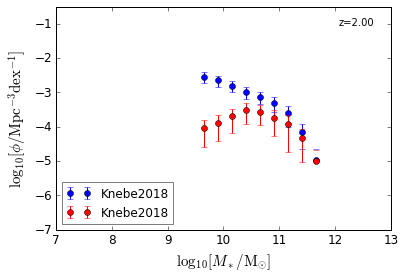
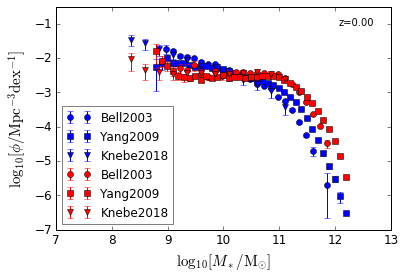
Blue & Red
[5]:
features = ['GSMF_Blue', 'GSMF_Red']
xlim     = (7, 13)
ylim     = (-7, -0.5)
xlabel   = r"$\log_{10}[M_*/{\rm M_{\odot}}]$"
ylabel   = r"$\log_{10}[\rm \phi/Mpc^{-3} dex^{-1}]$"
zs       = [2.0, 0.0]

for z in [2.0,0.0]:
    fig,ax = plt.subplots(1,1)
    for feature, color in zip(features, ['Blue', 'Red']):
        obs    = number_density(feature=feature,z_target=z,quiet=1,h=cosmo['h'])
        for ii in range(obs.n_target_observation):
            data       = obs.target_observation['Data'][ii]
            label      = obs.target_observation.index[ii]
            datatype   = obs.target_observation['DataType'][ii]
            marker     = markers[ii]
            data[:,1:] = np.log10(data[:,1:])
            ax.errorbar(data[:,0],  data[:,1], yerr = [data[:,1]-data[:,3],data[:,2]- data[:,1]],\
                        label=label,color=color,fmt=marker)

    ax.set_xlim(xlim)
    ax.set_ylim(ylim)
    ax.text(0.95,0.95, "z=%.2f"%z,horizontalalignment='right',\
          verticalalignment='top',transform=ax.transAxes)
    leg = ax.legend(loc='lower left')
    leg.get_frame().set_alpha(0.5)
    ax.set_xlabel(xlabel)
    ax.set_ylabel(ylabel)
/home/yqin/3rd_party/lib/python3.6/site-packages/ipykernel_launcher.py:17: RuntimeWarning: divide by zero encountered in log10
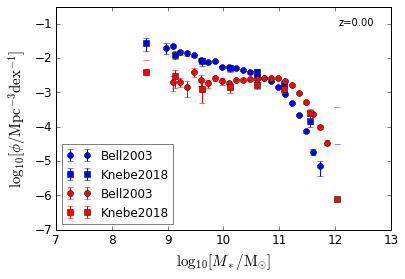
Disk & Bulge
[6]:
features = ['GSMF_Disk', 'GSMF_Bulge']
xlim     = (7, 13)
ylim     = (-7, -0.5)
xlabel   = r"$\log_{10}[M_*/{\rm M_{\odot}}]$"
ylabel   = r"$\log_{10}[\rm \phi/Mpc^{-3} dex^{-1}]$"
zs       = [2.0, 0.0]

for z in [0.0,]:
    fig,ax = plt.subplots(1,1)
    for feature, color in zip(features, ['Blue', 'Red']):
        obs    = number_density(feature=feature,z_target=z,quiet=1,h=cosmo['h'])
        for ii in range(obs.n_target_observation):
            data       = obs.target_observation['Data'][ii]
            label      = obs.target_observation.index[ii]
            datatype   = obs.target_observation['DataType'][ii]
            marker     = markers[ii]
            data[:,1:] = np.log10(data[:,1:])
            ax.errorbar(data[:,0],  data[:,1], yerr = [data[:,1]-data[:,3],data[:,2]- data[:,1]],\
                        label=label,color=color,fmt=marker)

    ax.set_xlim(xlim)
    ax.set_ylim(ylim)
    ax.text(0.95,0.95, "z=%.2f"%z,horizontalalignment='right',\
          verticalalignment='top',transform=ax.transAxes)
    leg = ax.legend(loc='lower left')
    leg.get_frame().set_alpha(0.5)
    ax.set_xlabel(xlabel)
    ax.set_ylabel(ylabel)
/home/yqin/3rd_party/lib/python3.6/site-packages/ipykernel_launcher.py:17: RuntimeWarning: divide by zero encountered in log10
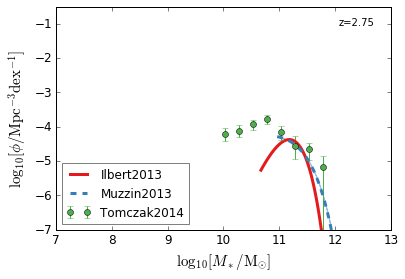
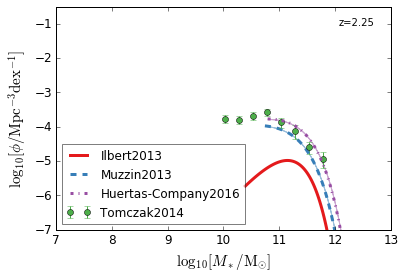
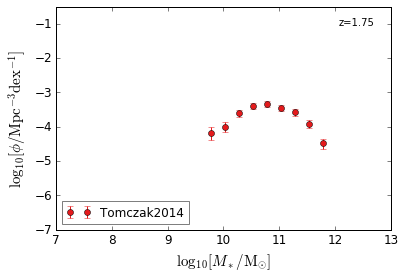
Quiescent
[7]:
feature = 'GSMF_Quiescent'
xlim    = (7, 13)
ylim    = (-7, -0.5)
xlabel  = r"$\log_{10}[M_*/{\rm M_{\odot}}]$"
ylabel  = r"$\log_{10}[\rm \phi/Mpc^{-3} dex^{-1}]$"
zs      = [2.75,2.25,1.75]

for z in zs:
    fig,ax = plt.subplots(1,1)
    obs    = number_density(feature=feature,z_target=z,quiet=1,h=cosmo['h'])
    j_data = 0
    k_func = 0
    for ii in range(obs.n_target_observation):
        data       = obs.target_observation['Data'][ii]
        label      = obs.target_observation.index[ii]
        datatype   = obs.target_observation['DataType'][ii]
        color      = colors[ii]
        marker     = markers[j_data]
        linestyle  = linestyles[k_func]
        data[:,1:] = np.log10(data[:,1:])
        if datatype == 'data':
            ax.errorbar(data[:,0],  data[:,1], yerr = [data[:,1]-data[:,3],data[:,2]- data[:,1]],\
                        label=label,color=color,fmt=marker)
            j_data +=1
        elif datatype == 'dataULimit':
            ax.errorbar(data[:,0],  data[:,1], yerr = -0.2*data[:,1], uplims=True,\
                        label=label,color=color,fmt=marker)
            j_data +=1
        else:
            ax.plot(data[:,0],data[:,1],label=label,color=color,linestyle=linestyle,lw=3)
            ax.fill_between(data[:,0], data[:,2],data[:,3],color=color,alpha=0.5)
            k_func +=1

    ax.set_xlim(xlim)
    ax.set_ylim(ylim)
    ax.text(0.95,0.95, "z=%.2f"%z,horizontalalignment='right',\
          verticalalignment='top',transform=ax.transAxes)
    leg = ax.legend(loc='lower left')
    leg.get_frame().set_alpha(0.5)
    ax.set_xlabel(xlabel)
    ax.set_ylabel(ylabel)
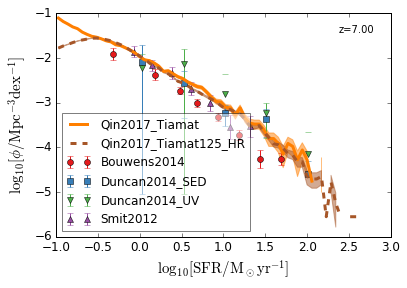
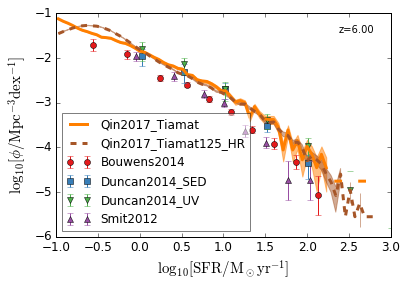
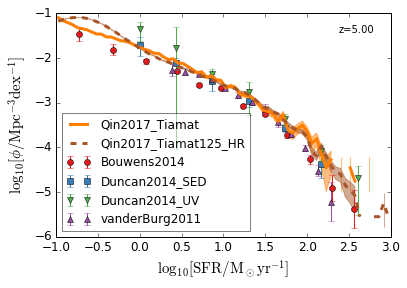
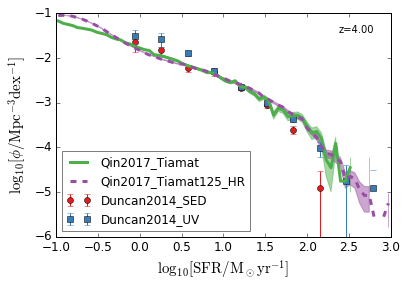
SFRF
Star Formation Rate Function
[8]:
feature = 'SFRF'
xlim    = (-1, 3)
ylim    = (-6, -1)
xlabel  = r"$\log_{10}[\rm SFR/M_\odot yr^{-1}]$"
ylabel  = r"$\log_{10}[\rm \phi/Mpc^{-3} dex^{-1}]$"
zs      = [7,6,5,4]

for z in zs:
    fig,ax = plt.subplots(1,1)
    obs    = number_density(feature=feature,z_target=z,quiet=1,h=cosmo['h'])
    j_data = 0
    k_func = 0
    for ii in range(obs.n_target_observation):
        data       = obs.target_observation['Data'][ii]
        label      = obs.target_observation.index[ii]
        datatype   = obs.target_observation['DataType'][ii]
        color      = colors[ii]
        marker     = markers[j_data]
        linestyle  = linestyles[k_func]
        data[:,1:] = np.log10(data[:,1:])
        if datatype == 'data':
            ax.errorbar(data[:,0],  data[:,1], yerr = [data[:,1]-data[:,3],data[:,2]- data[:,1]],\
                        label=label,color=color,fmt=marker)
            j_data +=1
        elif datatype == 'dataULimit':
            ax.errorbar(data[:,0],  data[:,1], yerr = -0.2*data[:,1], uplims=True,\
                        label=label,color=color,fmt=marker)
            j_data +=1
        else:
            ax.plot(data[:,0],data[:,1],label=label,color=color,linestyle=linestyle,lw=3)
            ax.fill_between(data[:,0], data[:,2],data[:,3],color=color,alpha=0.5)
            k_func +=1

    ax.set_xlim(xlim)
    ax.set_ylim(ylim)
    ax.text(0.95,0.95, "z=%.2f"%z,horizontalalignment='right',\
          verticalalignment='top',transform=ax.transAxes)
    leg = ax.legend(loc='lower left')
    leg.get_frame().set_alpha(0.5)
    ax.set_xlabel(xlabel)
    ax.set_ylabel(ylabel)
/home/yqin/3rd_party/lib/python3.6/site-packages/ipykernel_launcher.py:20: RuntimeWarning: divide by zero encountered in log10
/home/yqin/3rd_party/lib/python3.6/site-packages/ipykernel_launcher.py:22: RuntimeWarning: invalid value encountered in subtract
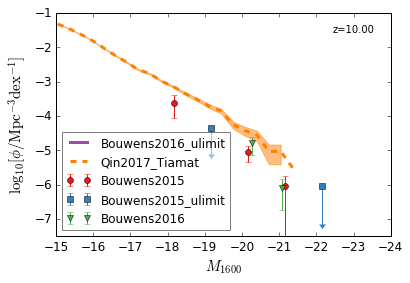
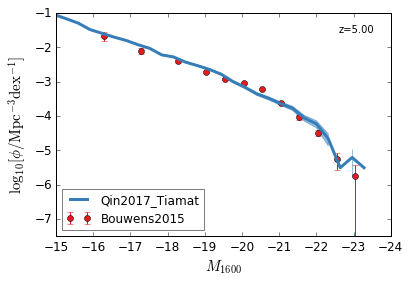
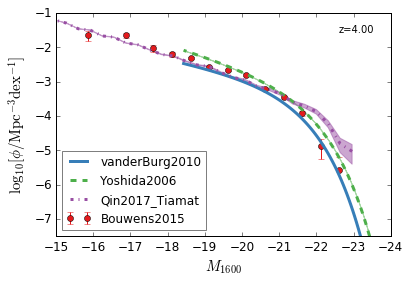
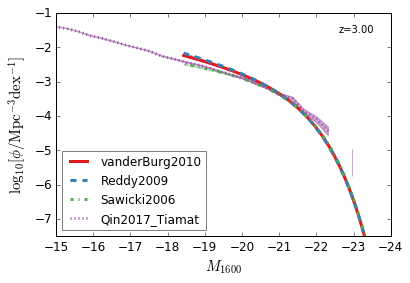
GLF
Galaxy Luminosity Function
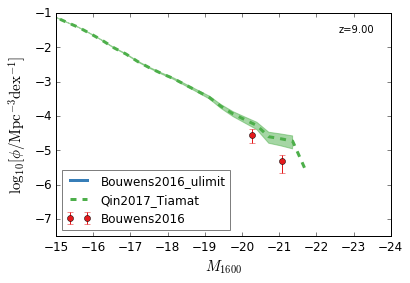
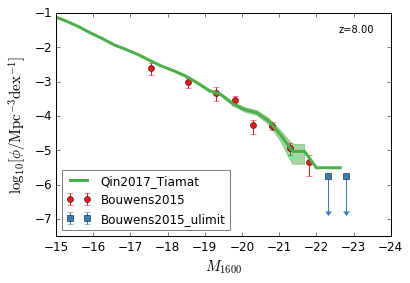
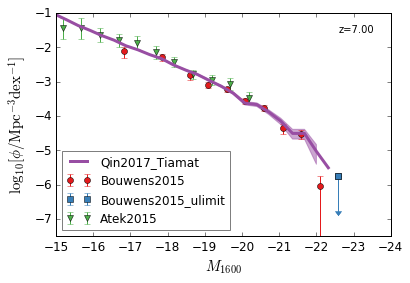
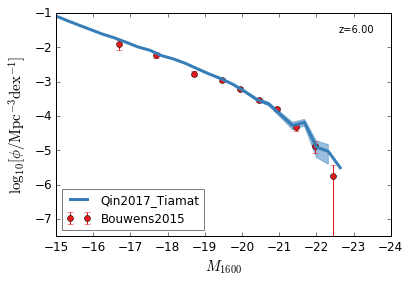
UV
[9]:
feature = 'GLF_UV'
xlim    = (-15,-24)
ylim    = (-7.5,-1)
xlabel  = r"$M_{1600}$"
ylabel  = r"$\log_{10}[\rm \phi/Mpc^{-3} dex^{-1}]$"
zs      = [10,9,8,7,6,5,4,3]

for z in zs:
    fig,ax = plt.subplots(1,1)
    obs    = number_density(feature=feature,z_target=z,quiet=1,h=cosmo['h'])
    j_data = 0
    k_func = 0
    for ii in range(obs.n_target_observation):
        data       = obs.target_observation['Data'][ii]
        label      = obs.target_observation.index[ii]
        datatype   = obs.target_observation['DataType'][ii]
        color      = colors[ii]
        marker     = markers[j_data]
        linestyle  = linestyles[k_func]
        data[:,1:] = np.log10(data[:,1:])
        if datatype == 'data':
            ax.errorbar(data[:,0],  data[:,1], yerr = [data[:,1]-data[:,3],data[:,2]- data[:,1]],\
                        label=label,color=color,fmt=marker)
            j_data +=1
        elif datatype == 'dataULimit':
            ax.errorbar(data[:,0],  data[:,1], yerr = -0.2*data[:,1], uplims=True,\
                        label=label,color=color,fmt=marker)
            j_data +=1
        else:
            ax.plot(data[:,0],data[:,1],label=label,color=color,linestyle=linestyle,lw=3)
            ax.fill_between(data[:,0], data[:,2],data[:,3],color=color,alpha=0.5)
            k_func +=1

    ax.set_xlim(xlim)
    ax.set_ylim(ylim)
    ax.text(0.95,0.95, "z=%.2f"%z,horizontalalignment='right',\
          verticalalignment='top',transform=ax.transAxes)
    leg = ax.legend(loc='lower left')
    leg.get_frame().set_alpha(0.5)
    ax.set_xlabel(xlabel)
    ax.set_ylabel(ylabel)
/home/yqin/3rd_party/lib/python3.6/site-packages/ipykernel_launcher.py:20: RuntimeWarning: invalid value encountered in log10
/home/yqin/3rd_party/lib/python3.6/site-packages/ipykernel_launcher.py:20: RuntimeWarning: divide by zero encountered in log10
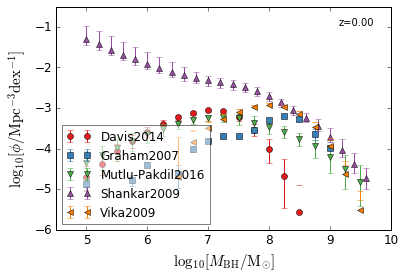
BHMF
Black Hole Mass Function
local
[10]:
feature = 'BHMF'
xlim    = (4.5, 10)
ylim    = (-6, -0.5)
xlabel  = r"$\log_{10}[M_{\rm BH}/{\rm M_{\odot}}]$"
ylabel  = r"$\log_{10}[\rm \phi/Mpc^{-3} dex^{-1}]$"
zs      = [0.0, ]

for z in zs:
    fig,ax = plt.subplots(1,1)
    obs    = number_density(feature=feature,z_target=z,quiet=1,h=cosmo['h'])
    j_data = 0
    k_func = 0
    for ii in range(obs.n_target_observation):
        data       = obs.target_observation['Data'][ii]
        label      = obs.target_observation.index[ii]
        datatype   = obs.target_observation['DataType'][ii]
        color      = colors[ii]
        marker     = markers[j_data]
        linestyle  = linestyles[k_func]
        data[:,1:] = np.log10(data[:,1:])
        if datatype == 'data':
            ax.errorbar(data[:,0],  data[:,1], yerr = [data[:,1]-data[:,3],data[:,2]- data[:,1]],\
                        label=label,color=color,fmt=marker)
            j_data +=1
        elif datatype == 'dataULimit':
            ax.errorbar(data[:,0],  data[:,1], yerr = -0.2*data[:,1], uplims=True,\
                        label=label,color=color,fmt=marker)
            j_data +=1
        else:
            ax.plot(data[:,0],data[:,1],label=label,color=color,linestyle=linestyle,lw=3)
            ax.fill_between(data[:,0], data[:,2],data[:,3],color=color,alpha=0.5)
            k_func +=1

    ax.set_xlim(xlim)
    ax.set_ylim(ylim)
    ax.text(0.95,0.95, "z=%.2f"%z,horizontalalignment='right',\
          verticalalignment='top',transform=ax.transAxes)
    leg = ax.legend(loc='lower left')
    leg.get_frame().set_alpha(0.5)
    ax.set_xlabel(xlabel)
    ax.set_ylabel(ylabel)
/home/yqin/3rd_party/lib/python3.6/site-packages/ipykernel_launcher.py:20: RuntimeWarning: divide by zero encountered in log10
/home/yqin/3rd_party/lib/python3.6/site-packages/ipykernel_launcher.py:20: RuntimeWarning: invalid value encountered in log10
/home/yqin/3rd_party/lib/python3.6/site-packages/ipykernel_launcher.py:22: RuntimeWarning: invalid value encountered in subtract
/home/yqin/3rd_party/lib/python3.6/site-packages/matplotlib/axes/_axes.py:2860: RuntimeWarning: invalid value encountered in double_scalars
  high = [thisx + thiserr for (thisx, thiserr)
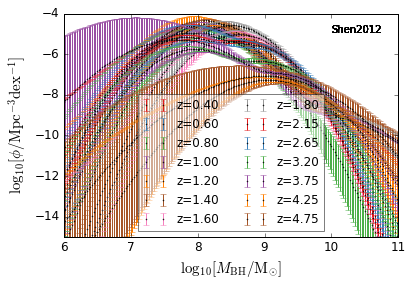
Shen et al. 2012
[11]:
feature = 'BHMF'
xlim    = (6, 11)
ylim    = (-15, -4)
xlabel  = r"$\log_{10}[M_{\rm BH}/{\rm M_{\odot}}]$"
ylabel  = r"$\log_{10}[\rm \phi/Mpc^{-3} dex^{-1}]$"
zs      = [0.4,0.6,0.8,1.0,1.2,1.4,1.6,1.8,2.15,2.65,3.2,3.75,4.25,4.75, ]

fig,ax = plt.subplots(1,1)
for z, color in zip(zs, colors):
    obs    = number_density(feature=feature,z_target=z,z_tol=0.05,quiet=1,h=cosmo['h'])
    j_data = 0
    k_func = 0
    for ii in range(obs.n_target_observation):
        if obs.target_observation.index[ii] != "Shen2012":
            continue
        data       = obs.target_observation['Data'][ii]
        label      = "z=%.2f"%z
        datatype   = obs.target_observation['DataType'][ii]
        marker     = markers[j_data]
        linestyle  = linestyles[k_func]
        data[:,1:] = np.log10(data[:,1:])
        if datatype == 'data':
            ax.errorbar(data[:,0],  data[:,1], yerr = [data[:,1]-data[:,3],data[:,2]- data[:,1]],\
                        label=label,color=color,fmt=marker,markersize=1)
            j_data +=1
        elif datatype == 'dataULimit':
            ax.errorbar(data[:,0],  data[:,1], yerr = -0.2*data[:,1], uplims=True,\
                        label=label,color=color,fmt=marker)
            j_data +=1
        else:
            ax.plot(data[:,0],data[:,1],label=label,color=color,linestyle=linestyle,lw=3)
            ax.fill_between(data[:,0], data[:,2],data[:,3],color=color,alpha=0.5)
            k_func +=1

    ax.set_xlim(xlim)
    ax.set_ylim(ylim)
    ax.text(0.95,0.95, "Shen2012",horizontalalignment='right',\
          verticalalignment='top',transform=ax.transAxes)
    leg = ax.legend(loc='lower center', ncol=2)
    leg.get_frame().set_alpha(0.5)
    ax.set_xlabel(xlabel)
    ax.set_ylabel(ylabel)
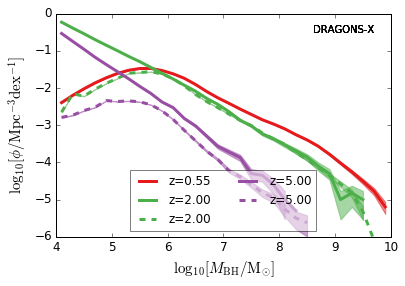
DRAGONS
[12]:
feature = 'BHMF'
xlim    = (4, 10)
ylim    = (-6, 0)
xlabel  = r"$\log_{10}[M_{\rm BH}/{\rm M_{\odot}}]$"
ylabel  = r"$\log_{10}[\rm \phi/Mpc^{-3} dex^{-1}]$"
zs      = [0.55,0.95,2.0,5.0,7.0]

fig,ax = plt.subplots(1,1)
for z, color in zip(zs, colors):
    obs    = number_density(feature=feature,z_target=z,z_tol=0.05,quiet=1,h=cosmo['h'])
    j_data = 0
    k_func = 0
    for ii in range(obs.n_target_observation):
        if "Qin" not in obs.target_observation.index[ii]:
            continue
        data       = obs.target_observation['Data'][ii]
        label      = "z=%.2f"%z
        datatype   = obs.target_observation['DataType'][ii]
        marker     = markers[j_data]
        linestyle  = linestyles[k_func]
        data[:,1:] = np.log10(data[:,1:])
        if datatype == 'data':
            ax.errorbar(data[:,0],  data[:,1], yerr = [data[:,1]-data[:,3],data[:,2]- data[:,1]],\
                        label=label,color=color,fmt=marker,markersize=1)
            j_data +=1
        elif datatype == 'dataULimit':
            ax.errorbar(data[:,0],  data[:,1], yerr = -0.2*data[:,1], uplims=True,\
                        label=label,color=color,fmt=marker)
            j_data +=1
        else:
            ax.plot(data[:,0],data[:,1],label=label,color=color,linestyle=linestyle,lw=3)
            ax.fill_between(data[:,0], data[:,2],data[:,3],color=color,alpha=0.5)
            k_func +=1

    ax.set_xlim(xlim)
    ax.set_ylim(ylim)
    ax.text(0.95,0.95, "DRAGONS-X",horizontalalignment='right',\
          verticalalignment='top',transform=ax.transAxes)
    leg = ax.legend(loc='lower center', ncol=2)
    leg.get_frame().set_alpha(0.5)
    ax.set_xlabel(xlabel)
    ax.set_ylabel(ylabel)
No available data of BHMF at 0.90<z_target<1.00
No available data of BHMF at 6.95<z_target<7.05
/home/yqin/3rd_party/lib/python3.6/site-packages/ipykernel_launcher.py:21: RuntimeWarning: divide by zero encountered in log10
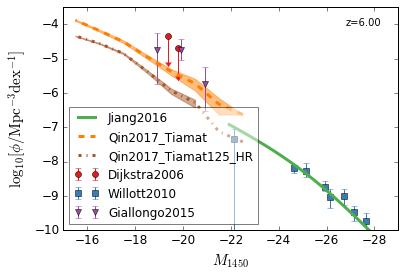
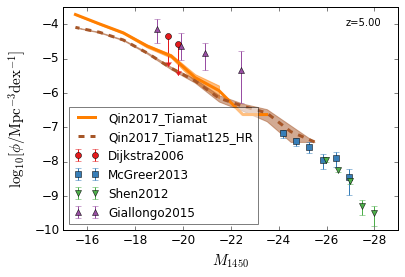
QLF
Quasar Luminosity Function
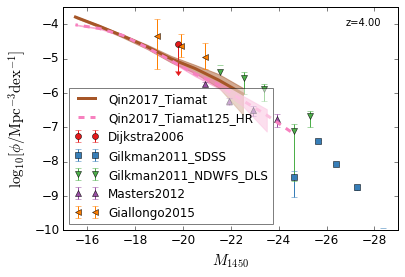
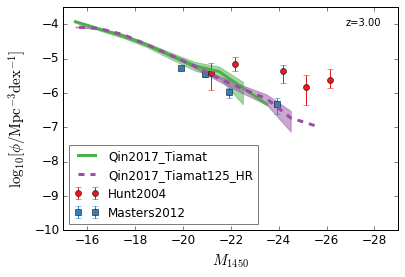
UV
[13]:
feature = 'QLF_UV'
xlim    = (-15, -29)
ylim    = (-10, -3.5)
xlabel  = r"$M_{1450}$"
ylabel  = r"$\log_{10}[\rm \phi/Mpc^{-3} dex^{-1}]$"
zs      = [6,5,4,3]

for z in zs:
    fig,ax = plt.subplots(1,1)
    obs    = number_density(feature=feature,z_target=z,quiet=1,h=cosmo['h'])
    j_data = 0
    k_func = 0
    for ii in range(obs.n_target_observation):
        data       = obs.target_observation['Data'][ii]
        label      = obs.target_observation.index[ii]
        datatype   = obs.target_observation['DataType'][ii]
        color      = colors[ii]
        marker     = markers[j_data]
        linestyle  = linestyles[k_func]
        data[:,1:] = np.log10(data[:,1:])
        if datatype == 'data':
            ax.errorbar(data[:,0],  data[:,1], yerr = [data[:,1]-data[:,3],data[:,2]- data[:,1]],\
                        label=label,color=color,fmt=marker)
            j_data +=1
        elif datatype == 'dataULimit':
            ax.errorbar(data[:,0],  data[:,1], yerr = -0.2*data[:,1], uplims=True,\
                        label=label,color=color,fmt=marker)
            j_data +=1
        else:
            ax.plot(data[:,0],data[:,1],label=label,color=color,linestyle=linestyle,lw=3)
            ax.fill_between(data[:,0], data[:,2],data[:,3],color=color,alpha=0.5)
            k_func +=1

    ax.set_xlim(xlim)
    ax.set_ylim(ylim)
    ax.text(0.95,0.95, "z=%.2f"%z,horizontalalignment='right',\
          verticalalignment='top',transform=ax.transAxes)
    leg = ax.legend(loc='lower left')
    leg.get_frame().set_alpha(0.5)
    ax.set_xlabel(xlabel)
    ax.set_ylabel(ylabel)
/home/yqin/3rd_party/lib/python3.6/site-packages/ipykernel_launcher.py:20: RuntimeWarning: invalid value encountered in log10
/home/yqin/3rd_party/lib/python3.6/site-packages/ipykernel_launcher.py:20: RuntimeWarning: divide by zero encountered in log10
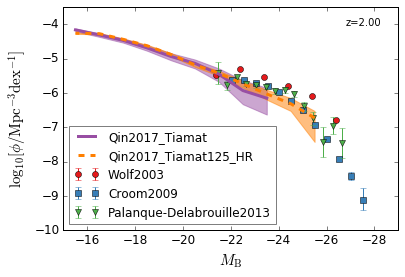
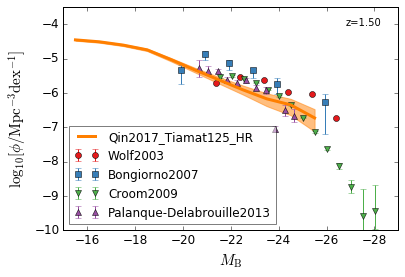
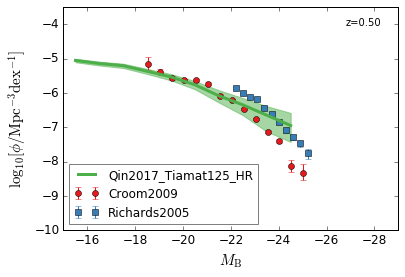
optical B
[14]:
feature = 'QLF_optical'
xlim    = (-15, -29)
ylim    = (-10, -3.5)
xlabel  = r"$M_{\rm B}$"
ylabel  = r"$\log_{10}[\rm \phi/Mpc^{-3} dex^{-1}]$"
zs      = [2,1.5,1.3,0.5]

for z in zs:
    fig,ax = plt.subplots(1,1)
    obs    = number_density(feature=feature,z_target=z,quiet=1,h=cosmo['h'])
    j_data = 0
    k_func = 0
    for ii in range(obs.n_target_observation):
        data       = obs.target_observation['Data'][ii]
        label      = obs.target_observation.index[ii]
        datatype   = obs.target_observation['DataType'][ii]
        color      = colors[ii]
        marker     = markers[j_data]
        linestyle  = linestyles[k_func]
        data[:,1:] = np.log10(data[:,1:])
        if datatype == 'data':
            ax.errorbar(data[:,0],  data[:,1], yerr = [data[:,1]-data[:,3],data[:,2]- data[:,1]],\
                        label=label,color=color,fmt=marker)
            j_data +=1
        elif datatype == 'dataULimit':
            ax.errorbar(data[:,0],  data[:,1], yerr = -0.2*data[:,1], uplims=True,\
                        label=label,color=color,fmt=marker)
            j_data +=1
        else:
            ax.plot(data[:,0],data[:,1],label=label,color=color,linestyle=linestyle,lw=3)
            ax.fill_between(data[:,0], data[:,2],data[:,3],color=color,alpha=0.5)
            k_func +=1

    ax.set_xlim(xlim)
    ax.set_ylim(ylim)
    ax.text(0.95,0.95, "z=%.2f"%z,horizontalalignment='right',\
          verticalalignment='top',transform=ax.transAxes)
    leg = ax.legend(loc='lower left')
    leg.get_frame().set_alpha(0.5)
    ax.set_xlabel(xlabel)
    ax.set_ylabel(ylabel)

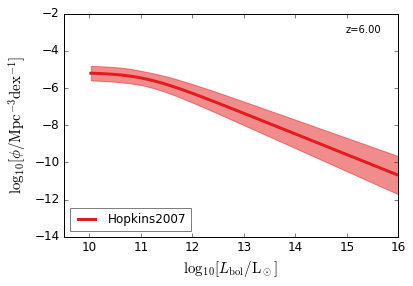
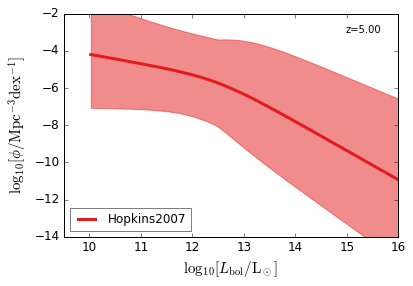
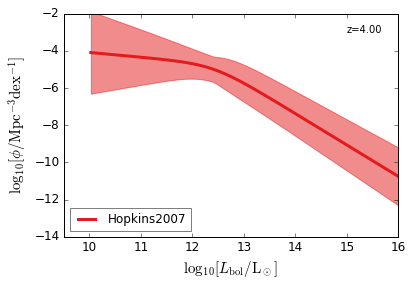
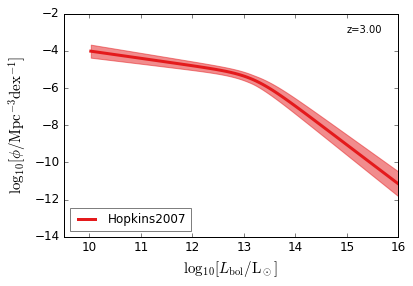
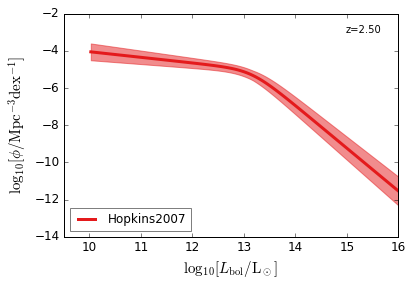
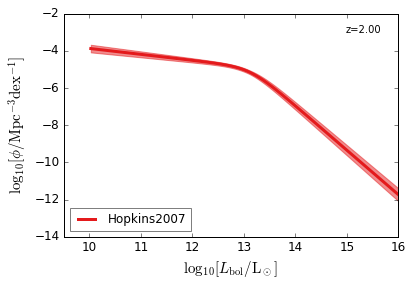
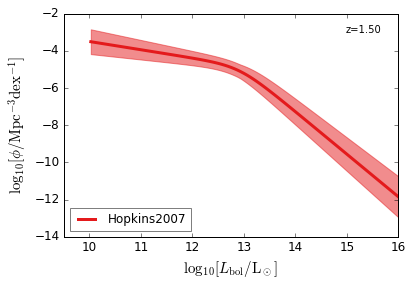
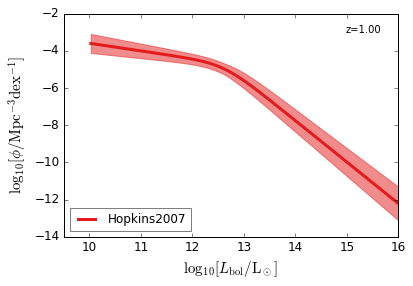
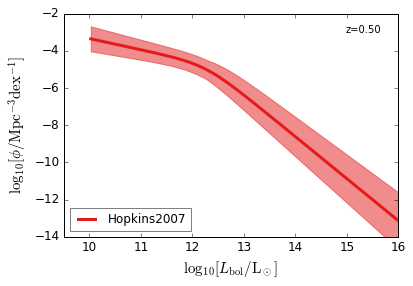
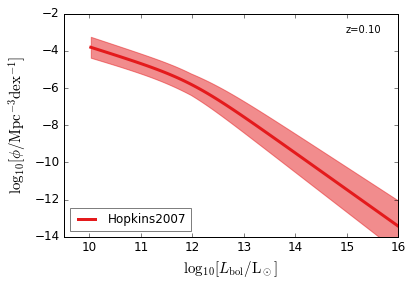
Bolometric
[15]:
feature = 'QLF_bolometric'
xlim    = (9.5, 16)
ylim    = (-14, -2)
xlabel  = r"$\log_{10}[L_{\rm bol}/{\rm L_\odot}]$"
ylabel  = r"$\log_{10}[\rm \phi/Mpc^{-3} dex^{-1}]$"
zs      = [6.0, 5.0, 4.0, 3.0, 2.5, 2.0, 1.5, 1.0, 0.5, 0.1]

for z in zs:
    fig,ax = plt.subplots(1,1)
    obs    = number_density(feature=feature,z_target=z,quiet=1,h=cosmo['h'])
    j_data = 0
    k_func = 0
    for ii in range(obs.n_target_observation):
        data       = obs.target_observation['Data'][ii]
        label      = obs.target_observation.index[ii]
        datatype   = obs.target_observation['DataType'][ii]
        color      = colors[ii]
        marker     = markers[j_data]
        linestyle  = linestyles[k_func]
        data[:,1:] = np.log10(data[:,1:])
        if datatype == 'data':
            ax.errorbar(data[:,0],  data[:,1], yerr = [data[:,1]-data[:,3],data[:,2]- data[:,1]],\
                        label=label,color=color,fmt=marker)
            j_data +=1
        elif datatype == 'dataULimit':
            ax.errorbar(data[:,0],  data[:,1], yerr = -0.2*data[:,1], uplims=True,\
                        label=label,color=color,fmt=marker)
            j_data +=1
        else:
            ax.plot(data[:,0],data[:,1],label=label,color=color,linestyle=linestyle,lw=3)
            ax.fill_between(data[:,0], data[:,2],data[:,3],color=color,alpha=0.5)
            k_func +=1

    ax.set_xlim(xlim)
    ax.set_ylim(ylim)
    ax.text(0.95,0.95, "z=%.2f"%z,horizontalalignment='right',\
          verticalalignment='top',transform=ax.transAxes)
    leg = ax.legend(loc='lower left')
    leg.get_frame().set_alpha(0.5)
    ax.set_xlabel(xlabel)
    ax.set_ylabel(ylabel)
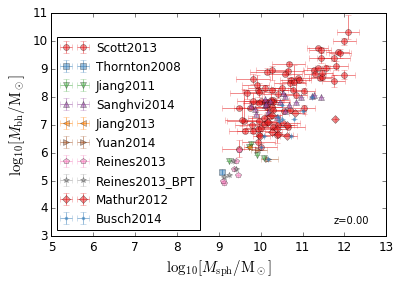
Magorrian Relation
[16]:
feature = 'Magorrian'
xlim   = (5, 13)
ylim   = (3, 11)
xlabel  = r"$\log_{10}[M_{\rm sph}/{\rm M_\odot}]$"
ylabel  = r"$\log_{10}[M_{\rm bh}/{\rm M_\odot}]$"
zs      = [0.0, ]

for z in zs:
    fig,ax = plt.subplots(1,1)
    obs    = correlation(feature=feature,z_target=z,quiet=1,h=cosmo['h'])
    for ii in range(obs.n_target_observation):
        data       = obs.target_observation['Data'][ii]
        label      = obs.target_observation.index[ii]
        datatype   = obs.target_observation['DataType'][ii]
        color      = colors[ii]
        marker     = markers[ii]
        linestyle  = linestyles[ii]
        data       = np.log10(data)
        if len(data)> 1e3:
            ax.hist2d(data[:,0], data[:,3],\
                      range = [xlim, ylim], bins=50,\
                      norm=LogNorm(), label=label, cmap=plt.get_cmap(color_maps[ii]))
            ax.text(0.05,0.05*ii, label,horizontalalignment='left',color=color,\
                      verticalalignment='bottom',transform=ax.transAxes)
        else:
            ax.errorbar(data[:,0],  data[:,3],\
                        xerr = [data[:,1]-data[:,0], data[:,0] - data[:,2]],\
                        yerr = [data[:,4]-data[:,3], data[:,3] - data[:,5]],\
                        label=label,color=color,fmt=marker,alpha=0.5)
    ax.set_xlim(xlim)
    ax.set_ylim(ylim)
    ax.text(0.95,0.05, "z=%.2f"%z,horizontalalignment='right',\
          verticalalignment='bottom',transform=ax.transAxes)
    leg = ax.legend(loc='lower left')
    ax.set_xlabel(xlabel)
    ax.set_ylabel(ylabel)
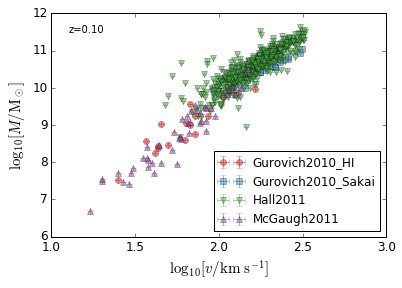
Tully_Fisher Relation
[17]:
feature = 'Tully_Fisher'
xlim   = (1, 3)
ylim   = (6, 12)
xlabel  = r"$\log_{10}[v/{\rm km\ s^{-1}}]$"
ylabel  = r"$\log_{10}[M/{\rm M_\odot}]$"
zs      = [0.1, ]

for z in zs:
    fig,ax = plt.subplots(1,1)
    obs    = correlation(feature=feature,z_target=z,quiet=1,h=cosmo['h'])
    for ii in range(obs.n_target_observation):
        data       = obs.target_observation['Data'][ii]
        label      = obs.target_observation.index[ii]
        datatype   = obs.target_observation['DataType'][ii]
        color      = colors[ii]
        marker     = markers[ii]
        linestyle  = linestyles[ii]
        data       = np.log10(data)
        if len(data)> 1e3:
            ax.hist2d(data[:,0], data[:,3],\
                      range = [xlim, ylim], bins=50,\
                      norm=LogNorm(), label=label, cmap=plt.get_cmap(color_maps[ii]))
            ax.text(0.05,0.05*ii, label,horizontalalignment='left',color=color,\
                      verticalalignment='bottom',transform=ax.transAxes)
        else:
            ax.errorbar(data[:,0],  data[:,3],\
                        xerr = [data[:,1]-data[:,0], data[:,0] - data[:,2]],\
                        yerr = [data[:,4]-data[:,3], data[:,3] - data[:,5]],\
                        label=label,color=color,fmt=marker,alpha=0.5)
    ax.set_xlim(xlim)
    ax.set_ylim(ylim)
    ax.text(0.05,0.95, "z=%.2f"%z,horizontalalignment='left',\
          verticalalignment='top',transform=ax.transAxes)
    leg = ax.legend(loc='lower right')
    ax.set_xlabel(xlabel)
    ax.set_ylabel(ylabel)
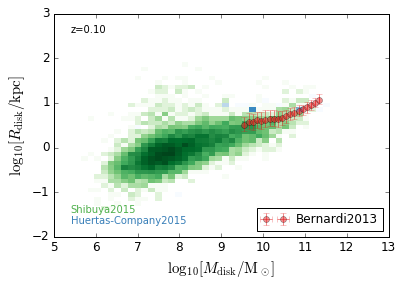
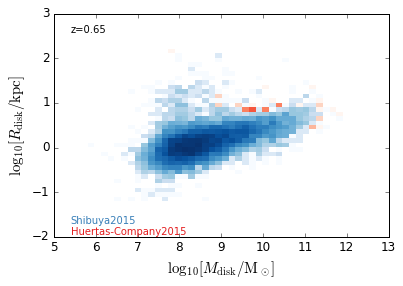
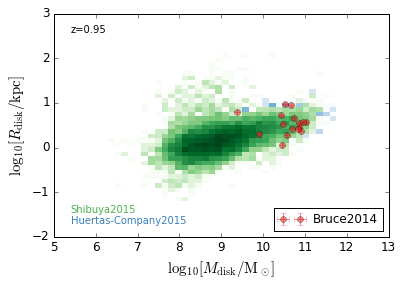
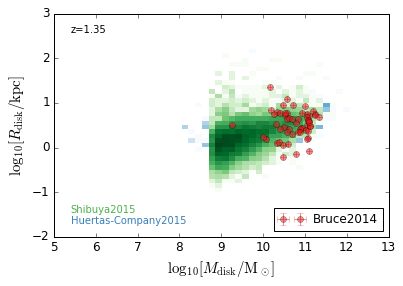
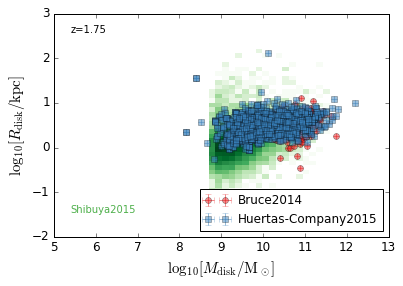
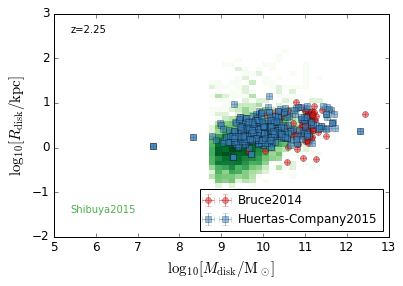
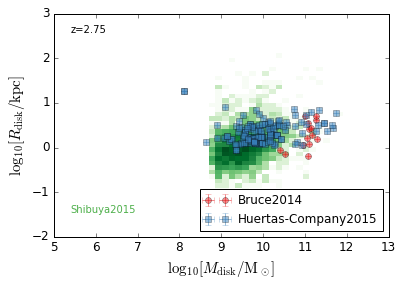
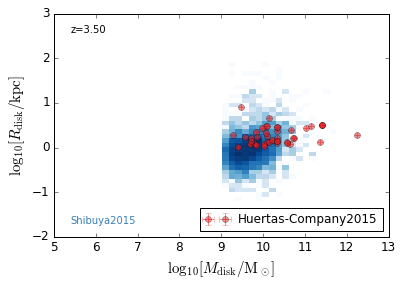
DiskSize_StellarMass
[18]:
feature = 'DiskSize_StellarMass'
xlim   = (5, 13)
ylim   = (-2, 3)
xlabel  = r'$\log_{10}[M_{\rm disk}/{\rm M_\odot}]$'
ylabel  = r"$\log_{10}[R_{\rm disk}/{\rm kpc}]$"
zs      = [0.1, 0.35, 0.65, 0.95, 1.35, 1.75, 2.25, 2.75, 3.5]

for z in zs:
    fig,ax = plt.subplots(1,1)
    obs    = correlation(feature=feature,z_target=z,quiet=1,h=cosmo['h'])
    for ii in range(obs.n_target_observation):
        data       = obs.target_observation['Data'][ii]
        label      = obs.target_observation.index[ii]
        datatype   = obs.target_observation['DataType'][ii]
        color      = colors[ii]
        marker     = markers[ii]
        linestyle  = linestyles[ii]
        data       = np.log10(data)
        if len(data)> 1e3:
            ax.hist2d(data[:,0], data[:,3],\
                      range = [xlim, ylim], bins=50,\
                      norm=LogNorm(), label=label, cmap=plt.get_cmap(color_maps[ii]))
            ax.text(0.05,0.05*ii, label,horizontalalignment='left',color=color,\
                      verticalalignment='bottom',transform=ax.transAxes)
        else:
            ax.errorbar(data[:,0],  data[:,3],\
                        xerr = [data[:,1]-data[:,0], data[:,0] - data[:,2]],\
                        yerr = [data[:,4]-data[:,3], data[:,3] - data[:,5]],\
                        label=label,color=color,fmt=marker,alpha=0.5)
    ax.set_xlim(xlim)
    ax.set_ylim(ylim)
    ax.text(0.05,0.95, "z=%.2f"%z,horizontalalignment='left',\
          verticalalignment='top',transform=ax.transAxes)
    leg = ax.legend(loc='lower right')
    ax.set_xlabel(xlabel)
    ax.set_ylabel(ylabel)
/home/yqin/3rd_party/lib/python3.6/site-packages/ipykernel_launcher.py:18: RuntimeWarning: divide by zero encountered in log10
/home/yqin/3rd_party/lib/python3.6/site-packages/ipykernel_launcher.py:18: RuntimeWarning: invalid value encountered in log10
/home/yqin/3rd_party/lib/python3.6/site-packages/matplotlib/axes/_axes.py:531: UserWarning: No labelled objects found. Use label='...' kwarg on individual plots.
  warnings.warn("No labelled objects found. "
/home/yqin/3rd_party/lib/python3.6/site-packages/ipykernel_launcher.py:23: RuntimeWarning: invalid value encountered in subtract

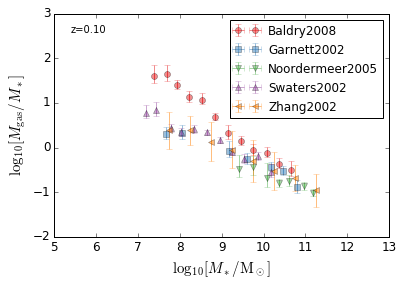
GasFraction_StellarMass
[19]:
feature = 'GasFraction_StellarMass'
xlim   = (5, 13)
ylim   = (-2,3)
xlabel  = r'$\log_{10}[M_*/{\rm M_\odot}]$'
ylabel  = r"$\log_{10}[M_{\rm gas}/M_*]$"
zs      = [0.1,]

for z in zs:
    fig,ax = plt.subplots(1,1)
    obs    = correlation(feature=feature,z_target=z,quiet=1,h=cosmo['h'])
    for ii in range(obs.n_target_observation):
        data       = obs.target_observation['Data'][ii]
        label      = obs.target_observation.index[ii]
        datatype   = obs.target_observation['DataType'][ii]
        color      = colors[ii]
        marker     = markers[ii]
        linestyle  = linestyles[ii]
        data       = np.log10(data)
        if len(data)> 1e3:
            ax.hist2d(data[:,0], data[:,3],\
                      range = [xlim, ylim], bins=50,\
                      norm=LogNorm(), label=label, cmap=plt.get_cmap(color_maps[ii]))
            ax.text(0.05,0.05*ii, label,horizontalalignment='left',color=color,\
                      verticalalignment='bottom',transform=ax.transAxes)
        else:
            ax.errorbar(data[:,0],  data[:,3],\
                        xerr = [data[:,1]-data[:,0], data[:,0] - data[:,2]],\
                        yerr = [data[:,4]-data[:,3], data[:,3] - data[:,5]],\
                        label=label,color=color,fmt=marker,alpha=0.5)
    ax.set_xlim(xlim)
    ax.set_ylim(ylim)
    ax.text(0.05,0.95, "z=%.2f"%z,horizontalalignment='left',\
          verticalalignment='top',transform=ax.transAxes)
    leg = ax.legend(loc='upper right')
    ax.set_xlabel(xlabel)
    ax.set_ylabel(ylabel)
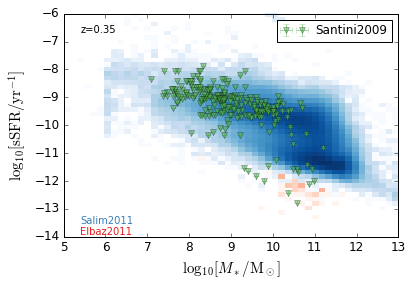
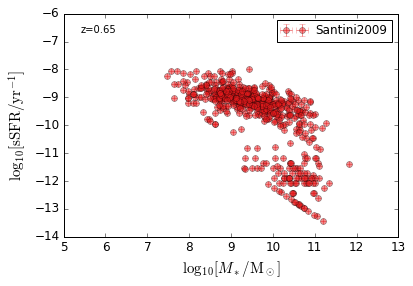
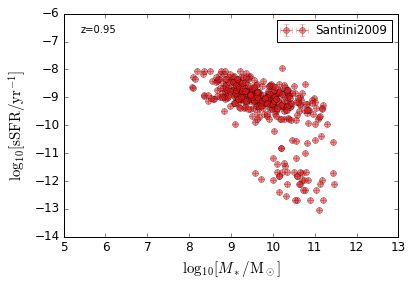
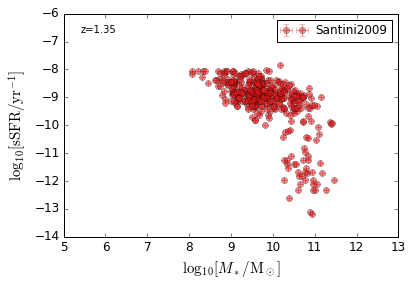
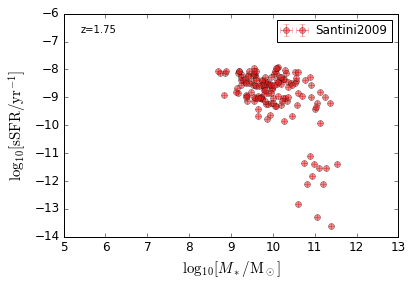
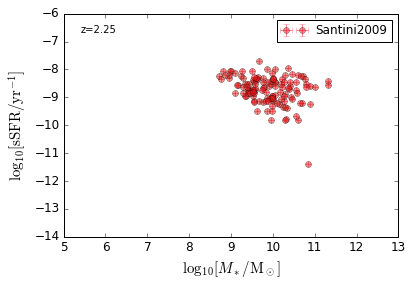
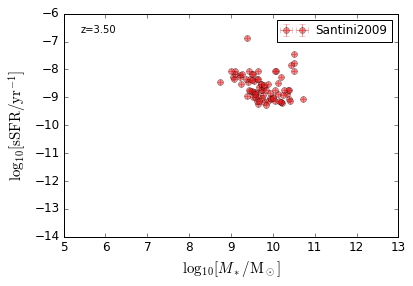
sSFR_StellarMass
Blue
[20]:
feature = 'sSFR_StellarMass_Blue'
xlim   = (5, 13)
ylim   = (-14, -6)
xlabel  = r'$\log_{10}[M_*/{\rm M_\odot}]$'
ylabel  = r"$\log_{10}[{\rm sSFR/yr^{-1}}]$"
zs      = [0.1, 0.35, 0.65, 0.95, 1.35, 1.75, 2.25, 2.75, 3.5]

for z in zs:
    fig,ax = plt.subplots(1,1)
    obs    = correlation(feature=feature,z_target=z,quiet=1,h=cosmo['h'])
    for ii in range(obs.n_target_observation):
        data       = obs.target_observation['Data'][ii]
        label      = obs.target_observation.index[ii]
        datatype   = obs.target_observation['DataType'][ii]
        color      = colors[ii]
        marker     = markers[ii]
        linestyle  = linestyles[ii]
        data       = np.log10(data)
        if len(data)> 1e3:
            ax.hist2d(data[:,0], data[:,3],\
                      range = [xlim, ylim], bins=50,\
                      norm=LogNorm(), label=label, cmap=plt.get_cmap(color_maps[ii]))
            ax.text(0.05,0.05*ii, label,horizontalalignment='left',color=color,\
                      verticalalignment='bottom',transform=ax.transAxes)
        else:
            ax.errorbar(data[:,0],  data[:,3],\
                        xerr = [data[:,1]-data[:,0], data[:,0] - data[:,2]],\
                        yerr = [data[:,4]-data[:,3], data[:,3] - data[:,5]],\
                        label=label,color=color,fmt=marker,alpha=0.5)
    ax.set_xlim(xlim)
    ax.set_ylim(ylim)
    ax.text(0.05,0.95, "z=%.2f"%z,horizontalalignment='left',\
          verticalalignment='top',transform=ax.transAxes)
    leg = ax.legend(loc='upper right')
    ax.set_xlabel(xlabel,fontsize=15)
    ax.set_ylabel(ylabel,fontsize=15)
/home/yqin/3rd_party/lib/python3.6/site-packages/astrodatapy-0.0.dev23-py3.6.egg/astrodatapy/correlation.py:480: RuntimeWarning: overflow encountered in power
  data = 10**data


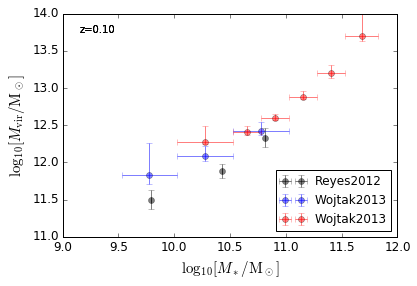
HaloMass_StellarMass
all & Blue & Red
[21]:
features = ['HaloMass_StellarMass', 'HaloMass_StellarMass_Blue', 'HaloMass_StellarMass_Red']
xlim     = (9, 12)
ylim     = (11, 14)
xlabel  = r'$\log_{10}[M_*/{\rm M_\odot}]$'
ylabel  = r"$\log_{10}[M_{\rm vir}/{\rm M_\odot}]$"
zs      = [0.1,]

for z in zs:
    fig,ax = plt.subplots(1,1)
    for feature, color  in zip(features, ['black', 'blue', 'red']):
        obs    = correlation(feature=feature,z_target=z,quiet=1,h=cosmo['h'])
        for ii in range(obs.n_target_observation):
            data       = obs.target_observation['Data'][ii]
            label      = obs.target_observation.index[ii]
            datatype   = obs.target_observation['DataType'][ii]
            marker     = markers[ii]
            linestyle  = linestyles[ii]
            data       = np.log10(data)
            if len(data)> 1e3:
                ax.hist2d(data[:,0], data[:,3],\
                          range = [xlim, ylim], bins=50,\
                          norm=LogNorm(), label=label, cmap=plt.get_cmap(color_maps[ii]))
                ax.text(0.05,0.05*ii, label,horizontalalignment='left',color=color,\
                          verticalalignment='bottom',transform=ax.transAxes)
            else:
                ax.errorbar(data[:,0],  data[:,3],\
                            xerr = [data[:,1]-data[:,0], data[:,0] - data[:,2]],\
                            yerr = [data[:,4]-data[:,3], data[:,3] - data[:,5]],\
                            label=label,color=color,fmt=marker,alpha=0.5)
        ax.set_xlim(xlim)
        ax.set_ylim(ylim)
        ax.text(0.05,0.95, "z=%.2f"%z,horizontalalignment='left',\
              verticalalignment='top',transform=ax.transAxes)
        leg = ax.legend(loc='lower right')
        ax.set_xlabel(xlabel)
        ax.set_ylabel(ylabel)
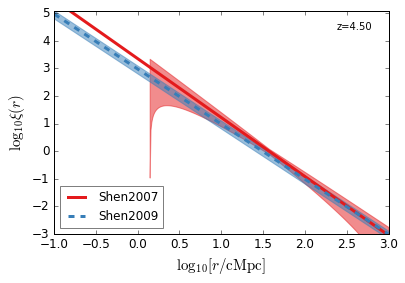
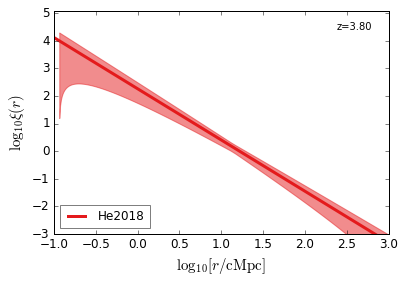
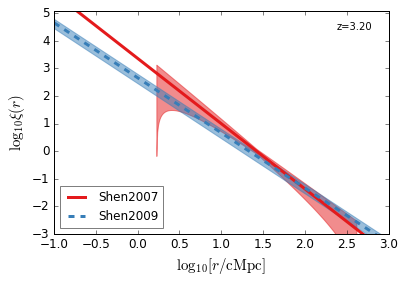
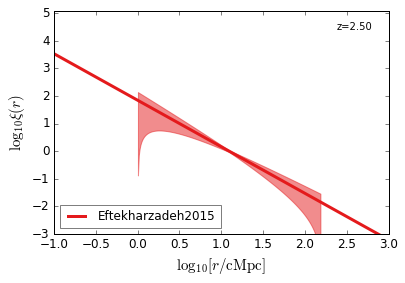
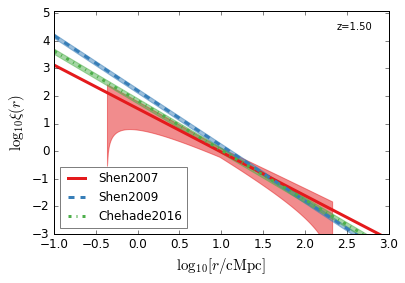
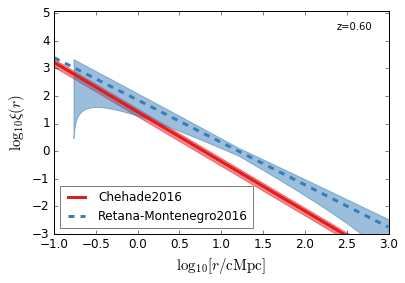
QC_2PTCF
Quasar Clustering 2 Point Correlaion Function
[22]:
feature = 'QC_2PTCF'
xlim    = (-1, 3)
ylim    = (-3, 5.1)
xlabel  = r"$\log_{10}[r/\mathrm{cMpc}]$"
ylabel  = r"$\log_{10}\xi(r)$"
zs      = [4.5, 3.8, 3.2, 2.5, 1.5, 0.6]

for z in zs:
    fig,ax = plt.subplots(1,1)
    obs    = clustering(feature=feature,z_target=z,quiet=1,h=cosmo['h'])
    j_data = 0
    k_func = 0
    for ii in range(obs.n_target_observation):
        data       = obs.target_observation['Data'][ii]
        label      = obs.target_observation.index[ii]
        datatype   = obs.target_observation['DataType'][ii]
        color      = colors[ii]
        marker     = markers[j_data]
        linestyle  = linestyles[k_func]
        data       = np.log10(data)
        if datatype == 'data':
            ax.errorbar(data[:,0],  data[:,1], yerr = [data[:,1]-data[:,3],data[:,2]- data[:,1]],\
                        label=label,color=color,fmt=marker)
            j_data +=1
        elif datatype == 'dataULimit':
            ax.errorbar(data[:,0],  data[:,1], yerr = -0.2*data[:,1], uplims=True,\
                        label=label,color=color,fmt=marker)
            j_data +=1
        else:
            ax.plot(data[:,0],data[:,1],label=label,color=color,linestyle=linestyle,lw=3)
            ax.fill_between(data[:,0], data[:,2],data[:,3],color=color,alpha=0.5)
            k_func +=1

    ax.set_xlim(xlim)
    ax.set_ylim(ylim)
    ax.text(0.95,0.95, "z=%.2f"%z,horizontalalignment='right',\
          verticalalignment='top',transform=ax.transAxes)
    leg = ax.legend(loc='lower left')
    leg.get_frame().set_alpha(0.5)
    ax.set_xlabel(xlabel)
    ax.set_ylabel(ylabel)
/home/yqin/3rd_party/lib/python3.6/site-packages/ipykernel_launcher.py:20: RuntimeWarning: invalid value encountered in log10
[ ]: